Tim Mattison

Hardcore tech

Deal With os_linux_zero.cpp Related JVM Crashes Without Using the Oracle JVM

| Comments

While running some relatively simple Java code on my Raspberry Pi I kept running into complete JVM crashes. These weren’t simple application crashes that I can quickly debug. It really was the JVM that my code was running on that was crashing.

The error message I received was similar to this:

1
2
3
4
5
6
7
8
9
10
11
12
13
14
15
16
17
18
#
# A fatal error has been detected by the Java Runtime Environment:
#
#  Internal Error (os_linux_zero.cpp:285), pid=10344, tid=3061261424
#  fatal error: caught unhandled signal 11
#
# JRE version: OpenJDK Runtime Environment (7.0_65-b32) (build 1.7.0_65-b32)
# Java VM: OpenJDK Zero VM (24.65-b04 mixed mode linux-arm )
# Failed to write core dump. Core dumps have been disabled. To enable core dumping, try "ulimit -c unlimited" before starting Java again
#
# An error report file with more information is saved as:
# /home/pi/hs_err_pid10344.log
#
# If you would like to submit a bug report, please include
# instructions on how to reproduce the bug and visit:
#   http://icedtea.classpath.org/bugzilla
#
Aborted

I dug and dug and dug and couldn’t figure out what was going on. The most common fix that I saw was to switch to the Oracle JVM. For this project I didn’t want to do that so I scoured the net and came up with the following two options.

For reference, my original command line was very simple. It was just java -jar test.jar.

NOTE: There may be performance issues with both of these options. I have not profiled them to see the difference. Then again, having your JVM crash can arguably be the lowest performance option possible.

Option 1: Add the -XX:+PrintCommandLineFlags option to your command line. This changed my command line to java -XX:+PrintCommandLineFlags -jar test.jar. Immediately the problem went away.

Option 2: Add the -jamvm option to your command line. This changed my command line to java -jamvm -jar test.jar. Again, immediately the problem went away

What is really happening behind the scenes? That gets complex quickly and I still don’t know the full answer. It turns out that this is a known but ignored bug in OpenJDK’s Zero VM. When you run java -version you can see if you’re running Zero VM or not like this:

1
2
3
4
pi@raspberrypi ~ $ java -version
java version "1.7.0_65"
OpenJDK Runtime Environment (IcedTea 2.5.1) (7u65-2.5.1-2~deb7u1+rpi1)
OpenJDK Zero VM (build 24.65-b04, mixed mode)

I don’t know why option 1 works. My guess is that that option disables some kind of optimization. Looking at what I think is the corresponding code in Hotspot on line 283 I can see that pthread_attr_getstack is used. The pthread_attr_getstack documentation says that it can only fail with EINVAL for one reason. It must be that addr “does not refer to an initialized thread attribute object”. I don’t have any clue how to fix this though.

Option 2 works because it switches over to JamVM. You can check your JamVM version like this:

1
2
3
4
pi@raspberrypi ~ $ java -jamvm -version
java version "1.7.0_65"
OpenJDK Runtime Environment (IcedTea 2.5.1) (7u65-2.5.1-2~deb7u1+rpi1)
JamVM (build 1.6.0-devel, inline-threaded interpreter with stack-caching)

So, if you’re in a similar bind and don’t want to install and switch to Oracle’s JVM give these options a try. Post your results in the comments below.
Making Javascript Logging a Little Less Expensive

| Comments

Disclaimer: I am not a Javascript expert. I don’t even play one on TV.

Everybody knows that logging isn’t free, don’t they? Well I don’t think that they do and for a lot of beginner to intermediate level developers I can’t really fault them for it. While you’re debugging it appears that log messages show up instantly so it is easy to forget that there is in fact a cost associated with producing them.

What is less obvious is that even when you “disable” your logging it still incurs a cost and that cost may be significantly larger than you think. The two main issues I’ve seen that often cause this large expense are:

  1. Methods that generate log messages
  2. Inline generation of strings

The first, methods that generate log messages, occurs when you need to do a bit of processing in order to make a meaningful log message. For example, you might need to know how far you are through a loop so you write a function called generateFormattedProgress that takes the number of loops you’re going to go through and the current loop counter as parameters. generateFormattedProgress generates a tidy little string that might loop like this [8% complete (currently on iteration 80,001 of 1,000,000)].

The second, inline generation of strings, happens when you need to do something a bit simpler like displaying a loop counter. You might build a string like this "Loop: " + loop_counter and then log it.

In both of these cases you get bitten by the less obvious issue I mentioned above when you disable logging. To be completely concrete about this imagine your logger is called like this:

Case #1:

1
console.log(generateFormattedProgress(loop_counter, total_loops));

Case #2:

1
console.log("Loop:" + loop_counter);

Even if you replace console.log with a function that just immediately returns you will, in most cases, still be forcing the machine to call generateFormattedProgress and perform the string concatenation only to throw the results away. This is where the overhead comes in.

Borrowing from some other languages I came up with an idea to reduce this burden. Unfortunately it is a bit ugly but it does give you a decent performance boost. The idea is that instead of always calling the logging code at runtime you wrap your logging statements in anonymous functions and pass those to the logger. The logger can then decide if it needs to run them and if it doesn’t then it never calls the code inside of the anonymous function.

Your log statements go from looking like the statements above to statements like this:

Case #1:

1
console.log(function(){ return generateFormattedProgress(loop_counter, total_loops);});

Case #2:

1
console.log(function(){ return "Loop:" + loop_counter; });

Some test code is below to illustrate the difference in performance. On my machine running 100,000 iterations I get the following results in Chrome 37.0.2062.94:

1
2
3
4
5
6
7
8
9
10
11
12
13
14
Console.log enabled
Running: test_normal_console
Total milliseconds: 1921
Milliseconds per log: 0.01921
Running: test_anonymous_function_console
Total milliseconds: 1917
Milliseconds per log: 0.01917
Disabling console.log
Running: test_normal_console
Total milliseconds: 16
Milliseconds per log: 0.00016
Running: test_anonymous_function_console
Total milliseconds: 5
Milliseconds per log: 0.00005

So here we see that we cut the runtime by at least two orders of magnitude going from a little over 1.9 seconds for each case to less than 20 milliseconds for each case. Does logging affect your Javascript application enough to use this pattern? Is this an anti-pattern? Are you already doing this or something similar? Post a message in the comments and lets discuss it!

Sample test code:

1
2
3
4
5
6
7
8
9
10
11
12
13
14
15
16
17
18
19
20
21
22
23
24
25
26
27
28
29
30
31
32
33
34
35
36
37
38
39
40
41
42
43
44
45
46
47
48
49
50
51
52
53
54
55
56
57
58
59
60
61
62
63
64
65
66
67
68
69
70
71
72
73
74
75
76
77
78
79
80
81
82
83
84
85
86
87
88
89
90
91
92
93
94
95
96
97
98
99
100
101
102
103
var test_count = 100000;

function get_timestamp() {
    return new Date().getTime();
}

function write_newline() {
    document.write("<br/>\n");
}

function display_function_name(caller) {
    var myName = caller.callee.toString();
    myName = myName.substr('function '.length);
    myName = myName.substr(0, myName.indexOf('('));

    document.write("Running: " + myName);
    write_newline();
}

function show_results(start, stop, count) {
    var totalMilliseconds = stop - start;
    var millisecondsPerLog = totalMilliseconds / test_count;

    document.write("Total milliseconds: " + totalMilliseconds);
    write_newline();
    document.write("Milliseconds per log: " + millisecondsPerLog);
    write_newline();
}

function test_normal_console() {
    display_function_name(arguments);

    var start = get_timestamp();

    for (var loop = 0; loop < test_count; loop++) {
        console.log("test! " + loop + "test!");
    }

    var stop = get_timestamp();

    show_results(start, stop, test_count);
}

function test_anonymous_function_console() {
    display_function_name(arguments);

    var start = get_timestamp();

    for (var loop = 0; loop < test_count; loop++) {
        console.log(function () {
            return "test! " + loop + "test!";
        });
    }

    var stop = get_timestamp();

    show_results(start, stop, test_count);
}

// Store the original console.log function
var original_console_log = console.log;

// Call this to enable logging
function enable_console_logging() {
    console.log = function (input) {
        // Why the bind(console)(input)?
        //
        // console.log expects "this" to refer to the console object or it crashes with an invocation exception
        //   See: https://stackoverflow.com/questions/8904782/uncaught-typeerror-illegal-invocation-in-javascript

        // Is this a function?
        if (typeof input == "function") {
            // Yes, call the function to get the data to log to the console
            original_console_log.bind(console)(input());
        }
        else {
            // No, just log it
            original_console_log.bind(console)(input);
        }
    }
}

// Call this to disable logging
function disable_console_logging() {
    console.log = function () {
    };
}

document.write("Console.log enabled");
write_newline();

enable_console_logging();

test_normal_console();
test_anonymous_function_console();

document.write("Disabling console.log");
write_newline();

disable_console_logging();

test_normal_console();
test_anonymous_function_console();

Using Guice Dependency Injection With Quartz Scheduling

| Comments

I am a big Guice advocate. I try to use it wherever it is possible and makes sense. While working on a project yesterday I realized that in order to use Guice and Quartz together you need to add in some glue code.

I found someone who had done the work already but their blog post was from 2009 and the Quartz API had changed a bit. Their implementation was very close so I made the necessary modifications, tested it out, and it works perfectly. If you’re wondering how to use Guice to get dependency injection into your Quartz scheduler code you can use the two snippets of code below to do it all for you.

The first thing you need is a custom job factory that will create your jobs using Guice. Here is the GuiceJobFactory:

1
2
3
4
5
6
7
8
9
10
11
12
13
14
15
16
17
18
19
20
21
22
23
24
25
26
27
28
29
30
31
32
33
34
35
36
37
38
39
40
import com.google.inject.Injector;
import org.quartz.Job;
import org.quartz.JobDetail;
import org.quartz.Scheduler;
import org.quartz.SchedulerException;
import org.quartz.spi.JobFactory;
import org.quartz.spi.TriggerFiredBundle;

import javax.inject.Inject;

/**
 * Created by timmattison on 8/4/14.
 */
// Some guidance from: http://codesmell.wordpress.com/2009/01/11/quartz-fits/
final class GuiceJobFactory implements JobFactory {
    private final Injector guice;

    @Inject
    public GuiceJobFactory(final Injector guice) {
        this.guice = guice;
    }

    @Override
    public Job newJob(TriggerFiredBundle triggerFiredBundle, Scheduler scheduler) throws SchedulerException {
        // Get the job detail so we can get the job class
        JobDetail jobDetail = triggerFiredBundle.getJobDetail();
        Class jobClass = jobDetail.getJobClass();

        try {
            // Get a new instance of that class from Guice so we can do dependency injection
            return (Job) guice.getInstance(jobClass);
        } catch (Exception e) {
            // Something went wrong.  Print out the stack trace here so SLF4J doesn't hide it.
            e.printStackTrace();

            // Rethrow the exception as an UnsupportedOperationException
            throw new UnsupportedOperationException(e);
        }
    }
}

The GuiceJobFactory gets the Guice injector injected into it. It then overrides the newJob method and creates each job using the injector it was given.

The next thing you need to do is to use this JobFactory in your Scheduler. Here’s how I built my scheduler and used it to create my first job:

1
2
3
4
5
6
Scheduler scheduler = StdSchedulerFactory.getDefaultScheduler();
scheduler.setJobFactory(injector.getInstance(GuiceJobFactory.class));

scheduler.start();

JobDetail jobDetail = newJob(MyJob.class).build();

Now the JobDetail object will be built from the GuiceJobFactory and it will get all the benefits of Guice’s dependency injection. Enjoy!

Fenced Code Blocks in Ordered Lists in Octopress

| Comments

While writing an article yesterday I ran into an issue getting fenced code blocks to work in markdown. I searched around and came across a gist that showed how to do it but I still couldn’t get it to work.

It turns out that the parser used in Octopress is slightly different than some of the other parsers out there and treats this markdown differently. There is an issue filed for this but the issue resolution is to use a workaround.

After some experimentation I came up with some simple steps that cover all the scenarios for putting code blocks or formatted text into an ordered list while writing my blog posts.

It is organized so that the two main scenarios include four different snippets of code. The first snippet of code is put directly before the entire block you want to format. The second snippet of code is put before each line of code. The third snippet of code is put after each line of code. The fourth snippet of code is put at the end of the entire block.

  1. No line numbers, no syntax highlighting. I use this when including snippets of commands that I have run from the console.

    1. Before the block – <div class="highlight"><pre><code>
    2. Before each line – <span class="line”>
    3. After each line – </span>
    4. After the block – </code></pre></div>
  2. No line numbers, syntax highlighting. I use this for regular code if I don’t care about line numbers. Replace LANGUAGE with the language you are using. For example, c or python (see the supported language list for more).

    1. Before the block – <div class="highlight"><pre><code class="LANGUAGE">
    2. Before each line – <span class="line”>
    3. After each line – </span>
    4. After the block – </code></pre></div>

If you want to do line numbers when syntax highlighting it gets messy. You need to build a table to have the line number “gutter” in there. You can do it but it is a bit more work.

Line numbers and syntax highlighting:

  1. Start a table that holds everything. This is the block you’ll use:

    
     <table><tbody><tr><td class=“gutter”><pre class=“line-numbers”>
     

  2. Determine how many lines are in your code snippet. Now create a line number row for each of them. Assuming you have five lines of code that would look like this:

    
     <span class=“line-number”>1</span>
     <span class=“line-number”>2</span>
     <span class=“line-number”>3</span>
     <span class=“line-number”>4</span>
     <span class=“line-number”>5</span>
     

  3. Close this column of the table and start the column for the code:

    
     </pre></td><td class=“code”><pre><code class=“LANGUAGE”>
     

  4. Before each line of code – <span class="line">

  5. After each line of code – </span>
  6. After the block – </code></pre></td></tr></tbody></table>

That should do it. Good luck!

Common Android Wear Tasks for Developers

| Comments

Getting started with development on the Android Wear platform can be challenging. Here are my notes on how to get started quickly.

Before you do anything! 1. Back up your IntelliJ configuration if you use IntelliJ at all. 2. Install Android Studio. Do NOT try to use IntelliJ to do Android Wear development.

Once you’ve got Android Studio installed you’ll need to do some setup on your devices (watch and phone) to get them working. Here I assume you’re using physical devices for your phone and your watch, no emulators.

Enabling debugging on your Android Wear device

The first time you set up your watch for remote debugging do the following:

  1. Tap your watch face to get the “Speak now” prompt
  2. Tap the screen again to get the list of options
  3. Scroll down to “Settings” and tap it
  4. Scroll down to “About” and tap it. If you see “Developer options” in this list already you do not need to do this procedure since it has already been done.
  5. Scroll down to “Build number” and tap it 7 times. You should get a message that says “You are now a developer!”.
  6. Swipe to the right to get the previous menu
  7. Scroll down to “Developer options” and tap it
  8. Tap “ADB debugging” if it says it is disabled
  9. Tap “Debug over Bluetooth” if it says it is disabled

After your Android Wear device has been set up once you’ll only need to follow these steps to re-enable debugging if you ever disable it:

  1. Tap your watch face to get the “Speak now” prompt
  2. Tap the screen again to get the list of options
  3. Scroll down to “Settings” and tap it
  4. Scroll down to “Developer options” and tap it
  5. Tap “ADB debugging” if it says it is disabled
  6. Tap “Debug over Bluetooth” if it says it is disabled

Enabling debugging over Bluetooth from your Android phone to your Android Wear device

  1. Open the “Android Wear” app
  2. Tap the settings icon at the top of the screen (the two gears that look like the icon below)

    two small gears

  3. Make sure “Debugging over Bluetooth” is checked
  4. Once it is checked two fields will appear below it. They are “Host” and “Target”. “Target” will say “connected” when your watch is connected to your phone. “Host” will say “connected” when ADB is connected to your watch.

Setting up ADB for Android Wear debugging over Bluetooth

Make sure ADB sees your phone:

  1. Connect your phone via USB and make sure USB debugging is enabled
  2. Run adb devices from the command line. You should get some output like this:

    
     $ adb devices
     List of devices attached
     01234567890abcdef    device
     

  3. Check to see if there is a device in the list called “localhost:4444”. If so, you are already paired and ready to go. You do not need to do this procedure.

  4. To connect ADB to your watch run adb forward tcp:4444 localabstract:/adb-hub; adb connect localhost:4444 and you should see this:

    
     $ adb forward tcp:4444 localabstract:/adb-hub; adb connect localhost:4444
     connected to localhost:4444
     

  5. Run adb devices again and you should see this:

    
     $ adb devices
     List of devices attached
     01234567890abcdef    device
     localhost:4444       device
     

  6. If you do not see the localhost:4444 entry then double check that ADB debugging and Bluetooth debugging are enabled on your watch. Then check to make sure Bluetooth debugging is enabled in the Android Wear app on your phone. Once those are verified you can run this command again and it will try to reconnect.

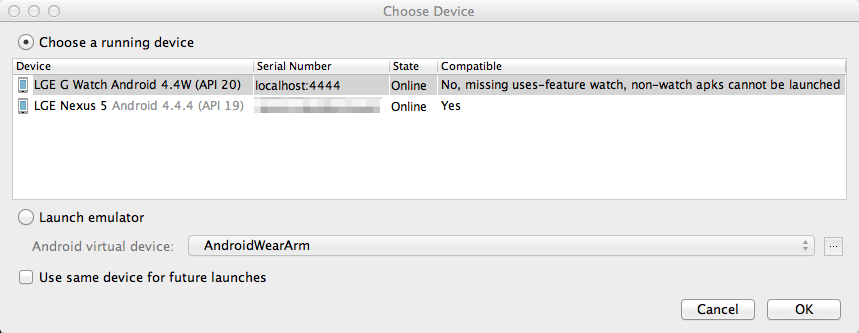
Now that you’ve done all of that Android Studio should give you a dialog like this when you try to run or debug an application:

"Choose Device" dialog

Tip: Bringing Your Working Directory (Pwd) to Another Terminal Window in Mac OS

| Comments

Mac OS, as far as I can remember, used to start tabbed Terminal sessions and put you into the working directory of your last tab. New Terminal windows didn’t do this but recently new Terminal tabs stopped doing it too.

I got tired of renavigating to the paths in the projects I was working on and I didn’t want to launch a Terminal from within a Terminal so I came up with something else. I added a few lines to my .bash_profile and now I have two new commands. ccd copies your current directory to the clipboard, and pcd pastes your clipboard into the cd command.

Now when I’m in a deep directory tree like this:

1
super-dooper-long-path/with/other-path/stuff/in/it $

I can do this in the existing Terminal:

1
super-dooper-long-path/with/other-path/stuff/in/it $ ccd

And this in the new Terminal:

1
2
$ pcd
super-dooper-long-path/with/other-path/stuff/in/it $

And there you have it. Back into my beloved directory in no time. Here’s what I added to .bash_profile.

1
2
3
4
5
6
alias ccd="pwd | pbcopy"
alias pcd="paste_cd"

function paste_cd() {
        cd "`pbpaste`"
}

The ccd alias just pipes pwd into pbcopy, which is one of the best tools ever, so that it ends up in the clipboard.

The pcd alias is a little more complex. If you try to do this without a bash function your alias will get evaluated as soon as your shell starts. This means that when you open your shell whatever is in your clipboard will be what pcd tries to cd to. Using a function we let it run pbpaste when it is called so it always uses the up-to-date info.

Enjoy! Let me know if you find it useful!

Automating Cisco Switch Interactions

| Comments

Recently I needed to find a way to reboot an embedded device remotely. The trick was that we didn’t have a handy Web Power Switch and the device was PoE. I figured that I’d just quickly slap together a script to telnet to the switch’s management interface and simulate a few simple commands. To make a long story short SSH was the only option which complicated things a bit.

Fortunately for me I had already written an article about this but that turned out only to be a starting point as the script just wouldn’t work out of the box with Cisco’s SSH server.

In the end I found a few very interesting things out about Paramiko and Cisco’s SSH server. Using Paramiko with a Cisco switch through out a bunch of errors like this:

1
2
3
4
5
6
7
8
9
10
11
12
Traceback (most recent call last):
  File "/Applications/PyCharm.app/helpers/pydev/pydevd.py", line 1733, in <module>
    debugger.run(setup['file'], None, None)
  File "/Applications/PyCharm.app/helpers/pydev/pydevd.py", line 1226, in run
    pydev_imports.execfile(file, globals, locals)  # execute the script
  File "poe-state.py", line 69, in <module>
    client.connect(switch_ip_address, username=username, password=password, look_for_keys=True)
  File "/usr/local/lib/python2.7/site-packages/paramiko/client.py", line 273, in connect
    self._auth(username, password, pkey, key_filenames, allow_agent, look_for_keys)
  File "/usr/local/lib/python2.7/site-packages/paramiko/client.py", line 456, in _auth
    raise saved_exception
paramiko.ssh_exception.AuthenticationException: Authentication failed.

If you are seeing Authentication failed messages while using Paramiko and you are certain your credentials are correct you may be running into the same problem I was. The issue is that Paramiko tries to use your SSH keys to do public key authentication before it tries to use your password. Normally, this doesn’t cause an issue because if it fails one authentication method it just moves onto trying the next authentication method. Due to a quirk in both Paramiko and Cisco’s SSH server implementation Paramiko gets confused after the public key authentication failure and gives up. I figured this out by turning on full debugging in Paramiko like this:

1
paramiko.common.logging.basicConfig(level=paramiko.common.DEBUG)

This is an incredibly handy flag if you ever need to debug Paramiko yourself so keep it around!

Anyway, the solution is normally to add the look_for_keys=False option to your Paramiko connect call. However, as I found out that works on some systems and not others. To be certain that it only tried password authentication I needed to also add the allow_agent=False flag.

The other quirk I hit was that my script initially waited forever for a response when I sent it commands that had a lot of output. This was because the Cisco shell’s pager was on. Turning it off meant sending one additional command terminal length 0\n.

In the end I ended up with a script that lets me check the PoE state of a port and enable/disable PoE on a per port basis. If you need a script that does that it is included below. Two important points to remember are that I only needed to use this on interfaces that start with Gi1/0/ so that value is hardcoded and you’ll need to change it if your switch is different. You will also need to install my little Python library called pyuda because I use it to process the command-line arguments. Rip that out if you want to simplify things.

1
2
3
4
5
6
7
8
9
10
11
12
13
14
15
16
17
18
19
20
21
22
23
24
25
26
27
28
29
30
31
32
33
34
35
36
37
38
39
40
41
42
43
44
45
46
47
48
49
50
51
52
53
54
55
56
57
58
59
60
61
62
63
64
65
66
67
68
69
70
71
72
73
74
75
76
77
78
79
80
81
82
83
84
85
86
87
88
89
90
91
92
93
94
95
96
97
98
99
100
101
102
103
104
105
106
107
108
109
110
111
112
113
114
115
116
117
118
119
120
121
122
123
124
125
126
127
128
129
130
131
132
133
134
135
136
#!/usr/bin/env python

__author__ = 'timmattison'

import pyuda
import re
import paramiko
import sys
import time

# For debugging only
# paramiko.common.logging.basicConfig(level=paramiko.common.DEBUG)

# This is part of the regex we use to look for the interfaces we care about
interface_regex = "Gi1\/0\/"

# These are the operation we support
status_operation = "status"
on_operation = "on"
off_operation = "off"
valid_operations = [status_operation, on_operation, off_operation]

def send_string_and_wait_for_string(command, wait_string, should_print):
    # Send the su command
    shell.send(command)

    # Create a new receive buffer
    receive_buffer = ""

    while not wait_string in receive_buffer:
        # Flush the receive buffer
        receive_buffer += shell.recv(1024)

    # Print the receive buffer, if necessary
    if should_print:
        print receive_buffer

    return receive_buffer

def validate_operation(operation):
    # Is this an operation we support?
    if(not operation in valid_operations):
        # No, tell them and bail out
        print operation + " is not a valid operation"
        sys.exit(-1)

# Get the command-line arguments
switch_ip_address, username, password, operation, port_number = pyuda.get_command_line_arguments(["Switch IP address", "Admin username", "Admin password", status_operation + ", " + on_operation + ", or " + off_operation, "Port number"])

# Make sure the operation makes sense
validate_operation(operation)

# Create an SSH client
client = paramiko.SSHClient()

# Make sure that we add the remote server's SSH key automatically
client.set_missing_host_key_policy(paramiko.AutoAddPolicy())

# Connect to the client
client.connect(switch_ip_address, username=username, password=password, allow_agent=False, look_for_keys=False)

# Create a raw shell
shell = client.invoke_shell()

# Wait for the prompt
send_string_and_wait_for_string("", "#", False)

# Disable more
send_string_and_wait_for_string("terminal length 0\n", "#", False)

# Which command are we trying to run?
if((operation == on_operation) or (operation == off_operation)):
    # Trying to do on or off

    # Send the "conf t" command
    send_string_and_wait_for_string("conf t\n", "(config)#", False)

    # Send the interface command
    send_string_and_wait_for_string("interface Gi1/0/" + str(port_number) + "\n", "(config-if)#", False)

    # Build the power command
    power_command = "power inline "

    # What kind of operation is this?
    if(operation == off_operation):
        # Power off, "never" means off
        power_command += "never"
    else:
        # Power on, "auto" means on (there are other options but this is the simplest)
        power_command += "auto"

    # Add the carriage return
    power_command += "\n"

    # Send the power command
    send_string_and_wait_for_string(power_command, "(config-if)#", False)
elif(operation == status_operation):
    # Get the status of all of the PoE ports
    power_data = send_string_and_wait_for_string("show power inline\n", "#", False)

    # Split the data into lines
    power_data_lines = power_data.splitlines()

    # We haven't found what we're looking for yet
    found = False

    # Loop through all of the lines
    for power_data_line in power_data_lines:
        # Does this look like the interface we want?
        if(not re.match("^" + interface_regex + port_number + "\s", power_data_line)):
            # No, keep going
            continue

        # Found the interface we want, split up the fields
        power_data_fields = power_data_line.split()

        # Get the second field which is the power state field and print it
        print power_data_fields[1]

        # We found what we needed
        found = True

        # Get out of the for loop
        break

    # Did we find what we needed?
    if not found:
        # No, let the user know
        print "Did not find port " + port_number

else:
    # This is an operation we didn't handle
    print operation + " not handled"

# Close the SSH connection
client.close()

Advanced Port Forwarding With SSH

| Comments

NOTE: This has all been done on a Mac running OS 10.9. YMMV on other operating systems or versions.

If you’ve ever had to use an SSH server as a jump off point, possibly to get to machines that don’t have a public IP address, then you know that it can be complicated to set up, manage, and annoying if you need to access a lot of machines and/or a lot of different services. Typically, using local port forwarding you can do something like this:

1
ssh -L8080:REMOTE_PRIVATE_SERVER:80 USER@REMOTE_PUBLIC_SERVER

That will let you connect to localhost on port 8080 to get to REMOTE_PRIVATE_SERVER’s port 80 service. What if you needed to get to two services? You start stacking them up:

1
ssh -L8080:REMOTE_PRIVATE_SERVER:80 -L8181:ANOTHER_REMOTE_PRIVATE_SERVER:80 USER@REMOTE_PUBLIC_SERVER

Now you can get to REMOTE_PRIVATE_SERVER’s port 80 service and ANOTHER_REMOTE_PRIVATE_SERVER’s port 80 service. You just have to configure your applications to use ports 8080 and 8181 on localhost instead of port 80 on the two remote hosts.

Wouldn’t it be nice if you could not worry about re-mapping ports and could just connect to REMOTE_PRIVATE_SERVER and ANOTHER_REMOTE_PRIVATE_SERVER as if they were hosts on your network? SSH does offer you a way to do this but I have never seen it documented anywhere. There is a way to create a VPN using pppd and a way to use SOCKS but those are no fun. I don’t want to use pppd and I have applications that don’t support SOCKS.

rsync and other applications that depend on SSH can be particularly tricky. On top of the command-line options you need to pass to your main application you need to pass options to SSH directly (not so bad), use each applications special syntax to pass those options to SSH (really bad), or convince the application to shell out to the OS with a specific command-line you’ve concocted for SSH (also really bad).

Instead, what I do is I make use of the 127.0.0.0/8 address space that is available to everyone but rarely used. You can always use 127.0.0.1 to access your local machine but you may not realize that you can bind to all of the rest of the addresses in that space.

I need to set up some terminology so this will be easier to discuss. The machine that you’re SSHing will be the “source machine”. The machine that is publicly accessible on the remote network that you SSH into will be called the “gateway machine”. The machine that provides the remote service that only has a private IP address will be called the “destination machine”.

My first use case is that the source machine wants to connect to a web server on the destination machine but I want to do it on port 80. We can do this:

1
2
sudo ifconfig lo0 alias 127.0.0.2
sudo ssh -L127.0.0.2:80:DESTINATION_MACHINE:80 user@GATEWAY_MACHINE

That first line creates an alias IP address of 127.0.0.2 on your lo0 interface. Then we ssh to the gateway machine and port forward the destination machine’s port 80 to 127.0.0.1. Since 80 is a privileged port you need to sudo your ssh session.

Now instead of having to point our browser to something like localhost:9000 we can point our browser directly to 127.0.0.2. What can we do this to make it even better? Create a host entry for 127.0.0.2 that gives it a descriptive name like remote_application_server.

Is that not enough? How about this:

1
2
sudo ifconfig lo0 alias 127.0.0.2
sudo ssh -L127.0.0.2:22:DESTINATION_MACHINE:22 user@GATEWAY_MACHINE

All that changed here is the port number. It was 80 and now it is 22 which is the ssh port. Now you can ssh to this machine in one step like this:

1
ssh user@127.0.0.2

This also means that you can sftp, scp, and rsync directly to that IP address. Without this trick to rsync you’d need to do something like this:

1
rsync -rvz -e 'ssh -p 2222' ./dir user@host:/dir

It may not seem like much but if you have to do it a lot it can get ugly. Especially since it is one of those options you always forget since you don’t use it that often.

I’m thinking about scripting the IP aliasing and port forwarding so that it can be specified in a simple configuration file. If you’re interested in that post in the comments below and let me know!

Forcing Java’s Logger to Work, Even When It Doesn’t Want To

| Comments

If you do any Java development I’m sure you’ve run into a situation where the logger just does not do what you want it to do. Sometimes you can’t get it to print messages other than INFO level messages, sometimes you can’t get it to print anything to the console at all.

In order to get around this I have a few convenience methods that I’ve migrated from project to project that I wanted to share. Soon I’ll put them in Jayuda when I revamp it. For now, you can just copy them from the blocks below.

NOTE: All of this info is for plain java.util.logging. If you are using another logging system this probably won’t work for you.

The first function makes sure that there is at least one console logger in your logging system.

1
2
3
4
5
6
7
8
9
10
11
12
13
14
15
16
17
18
19
20
21
22
23
24
25
26
27
public static void forceConsoleLogging() {
    // Get the root logger instance
    LogManager logManager = LogManager.getLogManager();
    Logger rootLogger = logManager.getLogger("");

    // Set the default logging level to all
    rootLogger.setLevel(Level.ALL);

    // Loop and see if a console handler is already installed
    boolean consoleHandlerInstalled = false;

    for (Handler handler : rootLogger.getHandlers()) {
        if (handler instanceof ConsoleHandler) {
            consoleHandlerInstalled = true;
            break;
        }
    }

    // Is a console handler already installed?
    if (consoleHandlerInstalled) {
        // Yes, do nothing
        return;
    }

    // No console handler installed, install one
    rootLogger.addHandler(new ConsoleHandler());
}

The second function is a bit more aggressive. It iterates over your console loggers and makes sure all of them log everything. You can use this in a pinch when you’re having serious issues and you need to see everything.

1
2
3
4
5
6
7
8
9
10
11
12
13
14
15
16
17
18
19
20
21
22
23
24
25
26
27
28
29
30
   public static void logEverything() {
        // Get the logger instance
        LogManager logManager = LogManager.getLogManager();
        Logger rootLogger = logManager.getLogger("");

        // Set the default logging level to all
        rootLogger.setLevel(Level.ALL);

        // Loop and see if any console handlers are already installed
        List<ConsoleHandler> consoleHandlers = new ArrayList<ConsoleHandler>();

        for (Handler handler : rootLogger.getHandlers()) {
            if (handler instanceof ConsoleHandler) {
                consoleHandlers.add((ConsoleHandler) handler);
            }
        }

        // Is a console handler already installed?
        if (consoleHandlers.size() == 0) {
            // No, create one.  Add it to the list and to the root logger.
            Handler consoleHandler = new ConsoleHandler();
            consoleHandlers.add((ConsoleHandler) consoleHandler);
            rootLogger.addHandler(consoleHandler);
        }

        // Loop through all console handlers and make them log everything
        for (ConsoleHandler consoleHandler : consoleHandlers) {
            consoleHandler.setLevel(Level.ALL);
        }
    }

If you do this be prepared to see TONS of output including output from all of the libraries you use. Most of the time this is overkill. But sometimes when the logger just won’t do what you want no matter how hard you try this will save your sanity.

Have better ways to do this? Did this get you out of a jam? Please post in the comments below.

UPDATE: Added to Jayuda!

A Collection of Software Testing and Dependency Injection Videos That All Developers Should Watch

| Comments

I often get asked about what recommendations I would make to people to make them better developers. After working on a very large project last year I have consistently told people that no matter what platform they use they should work on and think about two things: software testing and dependency injection.

Software testing includes unit tests, integration tests, regression tests, human testing, and a lot more. It is a broad set of topics that is hard to distill into just a few bits that will always be applicable.

But how about getting people to write code that is testable? Testability is an easy concept to gloss over. While there is a stigma associated with writing code that has no test coverage there is nowhere near as much of a stigma for having to jump through endless hoops to get your software to be tested. In fact, these hoops combined with time pressure are probably why a lot of developers don’t do proper testing.

There are three things that you can do immediately to start writing more testable code. First, learn the SOLID principle and if you need tighter focus then just start with S (single responsibility principle) and D (dependency inversion principle). Second, use a dependency injection framework (AKA “DI framework”). Third, try to follow the Law of Demeter as much as possible.

Here are some dependency injection framework recommendations:

  • For Java developers I recommend Guice.
  • For Android developers I recommend Dagger.
  • For .NET developers I recommend Ninject.

Those Wikipedia links are only meant for basic information on the topics. Once you’re ready to learn about these principles you can get a serious head start by watching a few videos. The videos by Misko Hevery are some of my favorites and they’re 30 minutes versus 60 minutes which is a little easier to carve out of your day. I suggest watching those first.

These videos are all part of the Google Tech Talk series.

30 minute sessions with Misko:

  • Don’t look for things – Discusses how the object model of a system may be broken if you’re not directly handed what your object needs to get its job done. In the best case this is handled automatically by dependency injection which makes it so you’re never shuffling in and out constructor argument lists as you swap implementations.
  • Global State and Singletons – Discusses how global state can silently break tests and how to try to avoid it
  • Unit Testing – Discusses how unit tests should be structured and that the goal should be to have unit tests that run so fast that you’re running them all the time. Integration tests and user simulations will still take longer but you should always try to write unit tests that run in milliseconds when possible. An interesting fact that he drops in this talk, I think, is that Google’s set of tests for a project are often as large as or even larger than the actual project itself.
  • Inheritance, Polymorphism, & Testing – Discusses how dense code can be unraveled with polymorphism and how that can make it easier to test and get complete testing coverage

60 minute sessions:

Have any other recommendations? Please post them in the comments below!